During the past couple days I have been working with Hyperic to setup basic alerting functionality for things like disk space thresholds, Windows Services and memory usage by process. Here is a quick getting started to setup basic disk monitoring as well as an intro to the Hyperic Escalation Schemes which allow tiered alerting.
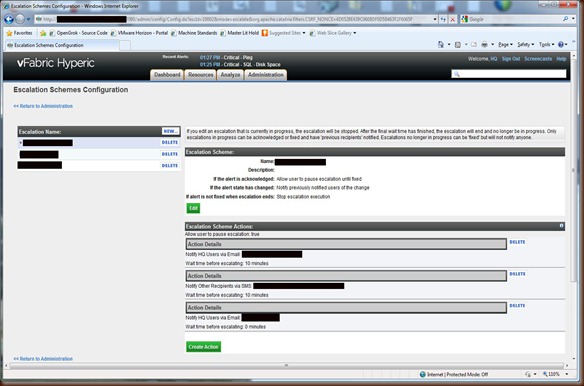
First off let’s create an Escalation Scheme. To do this go to Administration > Escalation Schemes Configuration.
Next Let’s go ahead and build the process of who gets alerted and when.
Now that we have setup the notification process let’s actually setup some alerts…For this example I will be setting up test disk space alerts on a subset of my servers. To get here you need to understand a few things:
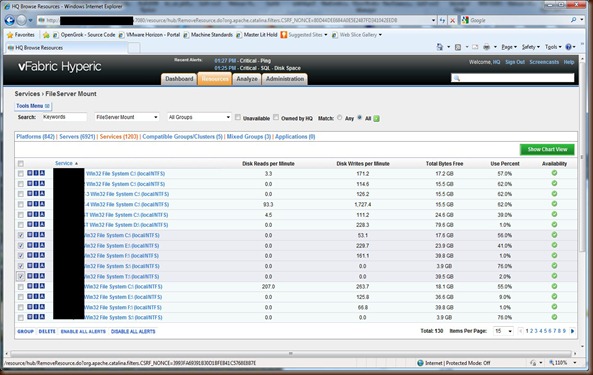
1. Under the Resources Tab is where you are going to find all your things that can be monitored. Here comes the confusing part:
a. Platforms is the Server that your Hyperic Agent is running on.
b. Servers are things like .net, Apache Tomcat and MSSQL Server.
c. Services are things that you monitor like HTTP, Disks, CPU, RAM and Windows Services.
d. Compatible Groups/Clusters are groups of the same thing (ie, Disks only)/
e. Mixed Groups are groups that contain a mix of things like Disks and RAM.
Once you grasp this it will make your experience with Hyperic much easier.
Ok, so I have navigated to the Services Tab and filtered by “FileServer Mount” aka Disk information. Now I want to select my subset of disks and click on the Group button.
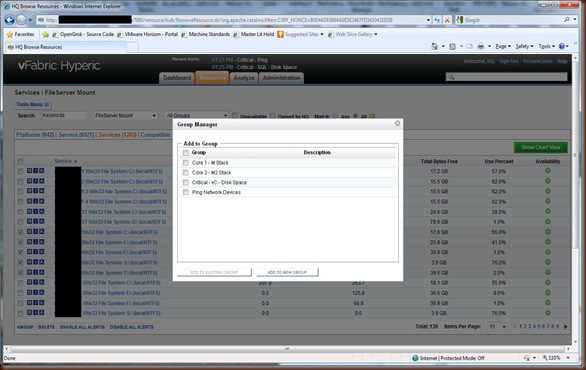
Next I click on "Add to a New Group” to create a new group. Because this group contains all like items it will create a new Compatible Group.
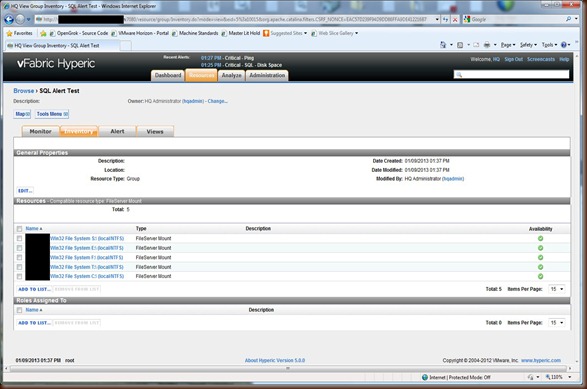
Now you should see your new group.
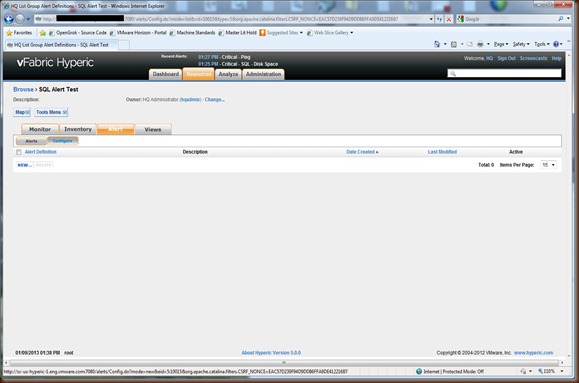
From there click on the Alerts tab and click on Configure
Now I want to create a new alert against this group of servers. My normal if statement is “IF more THAN 0 of the Resources” because I want alerts if any of them go down.
Here’s an important note: if you select Total Bytes Avail or several other metrics your alert will NOT work by default, here’s why:
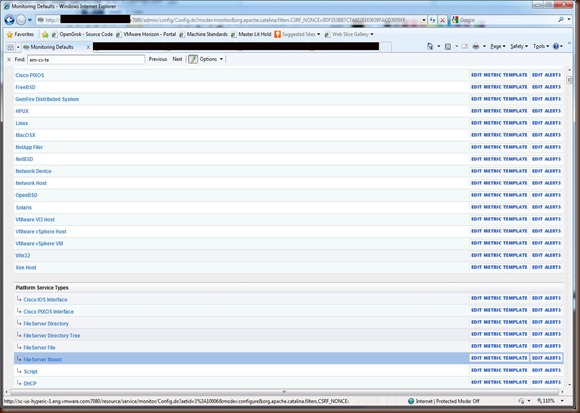
Go to Administration > Monitoring Defaults and find FileServer Mount and click Edit Metric Template.
This should bring up a screen like the below. Notice that the Default On is set to No for the Total Bytes Avail… if you build your alert on that setting and don’t check to make sure that valid data is coming in you might be lulled into a false sense of security… Word to the wise, make sure your monitors are green after you create them.
Congrats, you are now ready to use vFabric Hyperic to start basic monitoring in your environment.



Hi Caleb, I'm trying configure a basic disk alerts against a set of servers on Hyperic, but it isn't working.
ReplyDeleteI did exactly steps on this post, except by Condition Set, where I used Percent Use >=80.0%.
I have some FileServer Mounts (Like C:\) that match with condition but no alert is trigged.
do You Have any idea what might be the error?
Thanks,
Jairo Rodrigues