Friday, October 14, 2016

Find DN of my user in AD

Sometimes you need to know what your DN is in Active Directory and want a quick way to find it without powershell scripts or AD related tools. This command is the best way I've see thus far to accomplish it:

whoami /fqdn

Wednesday, October 5, 2016

Getting Fancy with Log Insight Alerting (aka. Monitoring DHCP pools via logs)

Recently, I was asked about monitoring Microsoft DHCP IP Address Pools using Log Insight to alert when the pool was exhausted and DHCP requests were failing. There are a couple ways to do this, but I'd like to cover two as a demonstration of getting a bit fancy with your alert queries and it paying off big time!

First off, Microsoft DHCP Servers write their events to a log file - at the end of the day.... so we can parse that file for an Event ID of 14 to see when we ran out. This is easy to do as shown below using Event ID 11 (DHCP Renew) as an example. The regex is simple but unfortunately we get the information way too late!


Enter the Log Insight Agent's ability to read Windows Event Logs! As your DHCP Server starts running low on available addresses in a certain pool it starts to throw warnings in the System Event Log with an Event ID of 1376 that state what percent is currently used and how many addresses are still available.


It would be really cool if we could have Log Insight fire off an alert if these messages showed that we were above 90% used, right? But it's text... how do we do math on text in log messages? The good news is that not only can you accomplish this; it's easy to do!

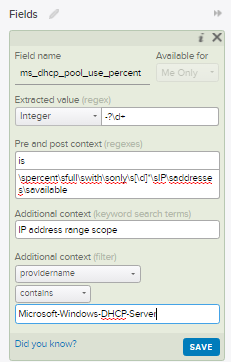
First off, we need to create an Extracted Field that allows us to treat the value of percentage used as an integer. Simply highlight the number and select "Extract Field"

Now you will have a dialog box on the right hand side that allows you to define what exactly makes this extracted field. Let's look into these options with a bit of detail...
Extracted Value: For this use case you will be leaving this field alone as any changes will remove the type of "Integer". This can be problematic if you have numbers with a comma (1,000) but the engineering team is aware of it. For now, leave it as is.

Pre Context: This is a regex defining what comes before our desired value. In this example it is the word "is" from "is 85 percent full".

Post Context: The same as pre-context just for the regex after the value. It's important to make both the pre and post context detailed enough that they only apply to this exact context/event type. It's better to go a bit overboard with the regex than make it too simple. Just make sure to keep some room available in the text for the next item, keyword search terms....

Additional Context (keyword search terms): In this section you'll want to add in keywords that are found in the data outside of your regex. In this case my keywords match strings found before my pre-context regex. These are important as they help improve your query performance and lighten the load on your Log Insight Server.

Additional Context (filter): Why search through 2 billion events when you only need to search 100? That's exactly why you should also use filters to help narrow down where this Extracted Field will apply. Your users will thank your for keeping the performance on your Log Insight Server at peak efficiency!

Now that we have our Extracted Field defined we can modify our initial query to have an additional filter that says "ms_dhcp_pool_use_percent" (Name of our new Extracted Field) is greater that X%! This is demonstrated in the below screenshot where everything below 86% is dropped, and consequentially, would never be alerted on.


Lastly we need to define an alert off of our new query. Select the little red bell and select "Create Alert from Query"

Here we define the new alert properties for when our alert query returns a result.

And with that you're done!

Special thanks to my co-worker Simon Long for bringing up the need for this cool use case!


Thursday, September 22, 2016

Corrupt Microsoft SQL Database Log in AlwaysOn High Availability Group (AAG)

We recently ran into an issue with one of our environments where the Microsoft SQL Server experienced corruption in the database log. This issue is usually discovered when you attempt to create a new backup and it fails with the message "BACKUP detected corruption in the database log"


Resolving this issue is normally fairly easy (set the database from a Full Recovery Model to simple and then back again) but it gets a bit more complex when you database is replicated via an AlwaysOn High Availability Group. Here are the steps to fix it (assuming no other databases are in the AAG).

1. Remove Secondary Replica - First we need to stop replication to the secondary replica. To do this we are going to connect to the primary node in our cluster and right click on the SECONDARY replica. Then we select "Remove from Availability Group" and follow the wizard.


2. Remove Database from AAG - Next we need to remove the database from the AAG by right clicking on it under the Availability Databases folder and selecting "Remove Database from Availability Group"

At this point you should have your primary node as the only member of the AAG with no databases associated. At this point you are going to delete the database from the SECONDARY node. Your secondary server should now have no replicas, no availability databases and no database. 

3. Next we need to change the remaining copy of the database on our primary node from Full to a Simple Recovery Model by right clicking on the database and selecting properties > Options.

4. Next we need to do a full backup of the database.
5. Repeat the steps in #3 but in this case change it from simple back to the original Full Recovery Model.
6. Backup the database again.

Now we are ready to re-add the secondary replica

7. On the primary server right click on the Available Replicas folder and select "Add Replica..."
Next you will need to select the "Add Replica" button and will be prompted to connect to your secondary server.

After this you will want to configure your replica. In our case we have selected to have the secondary copy of the database as readable as well as enabling automatic failover.

In the next screen you will need to configure your sync preferences. We are using a Full sync which requires a file share accessible by both SQL Servers. Using this file share SQL will run a backup and place it on the remote share and the secondary node will restore the database from this initial backup. 

Follow the wizard and verify that everything passes

After this you can track the progress of the backup/restore/sync

With that you should have a working AlwaysOn Availability Group again!

Friday, September 16, 2016

FreeTDS and Microsoft SQL Server Windows Authentication - Part 1

I've been trying to get the Zenoss SQL Transaction Zenpack working so that we can use Zenoss to run SQL queries for specific monitoring purposes and ran into a few things that might be worth sharing.

Using tsql for troubleshooting

Zenoss, among many other tools uses pymssql to connect to your SQL Servers; and pymssql uses FreeTDS behind the scenes. If you can't get pymssql to work them you can go a layer deeper to see if you can find the issues. In my case I have the following configuration:

Fedora Server 23
freetds-0.95.81-1
pymssql-2.1.3

First off, FreeTDS uses a config file at /etc/freetds.conf that has a [Global] section and examples for configuring individual server types. This is important because you need to use TDS version 7.0+ for Windows Authentication to work.

If we try to connect using the diagnostic tool tsql (not to be confused with the language T-SQL) without changing the default TDS version or adding a server record in the config file our attempts will fail

To fix this you can either:
Change the Global value for "tds version" to be 7+ (sounds like a good idea to me if you only have MSSQL):

or you can add a server record for each Microsoft SQL Server and leave the global version less than 7.


The catch to second method is that when you do your queries you will have to call the name as shown in the config file (in this case us01-0-srs1) and you cannot use the FQDN or it will fail because it defaults back to the Global setting. This method also creates overhead in managing the list of MSSQL Servers in the freetds.conf file.


Either way, at this point you should have tsql being able to query your MSSQL Servers using Windows Authentication


Getting started with pymssql
To make sure that pymssql is working I threw together a quick bit of python that allows you to connect using Windows Authentication


It's basically a simplified version of the example on the pymssql web page, but will prove if pymssql and MSSQL Windows Authentication is working or not.

-------------BEGIN Code
import pymssql

print('Connecting to SQL')
conn = pymssql.connect(server='server.domain.com', user='DOMAIN\\username', password='Super Secret P@ssW0rds', database='master')

print('Creating cursor')
cursor = conn.cursor()

print('Executing query')
cursor.execute("""
SELECT MAX(req.total_elapsed_time) AS [total_time_ms]
FROM sys.dm_exec_requests AS req
WHERE req.sql_handle IS NOT NULL
""")

print('Fetching results')
row = cursor.fetchone()
while row:
    print(row[0])
    row = cursor.fetchone()

print('Closing connection')
conn.close
-------------END Code 

After filling in the details on your MSSQL Server you can simply run it and get the results


Part 2 will cover the Zenoss specific aspects of this...

Friday, August 26, 2016

Zenoss and ServiceNow Integration - Custom Fields and Values

Our Zenoss instance is integrated with ServiceNow so that our support organization can open an incident with the appropriate event details at the click of a button from the Zenoss Events Console. The workflow for this looks something like the below flowchart that I just threw together.

The problem however is that our Zenoss instance was not following through in the last step after incident resolution and closing out the associated Zenoss Event. Because of this we were missing alerts on re-occurring issues since the event was in an acknowledged state. By default the Zenoss Incident Management ZenPack looks at the incident_state field for values 6 and 7 to indicate a closed event. However, our ServiceNow instance uses the underlying state field that is inherited from the task table that the Incidents table is built on top of instead of incident_state.
You can find out what field you are using by right clicking on the State label and either seeing the "Show - ''" or clicking on "Configure Label" which will show you the associated table


Next we need to find out the appropriate values associated with the state so that we can update Zenoss. Open the Task table under "System Definition - Tables". 


Then open the state column. (You can do this by clicking on the information button).


Next you will want to filter the results down to the Incident table and you will be able to find the integer values for your state.


In this case I want an incident with a state value greater than 3 to be considered from a Zenoss point of view to be "closed" and monitoring to be re-enabled by moving the Zenoss event from an "Acknowledged" state to "Closed".

Now, to make the change on our Zenoss server we need to create a snapshot of the Zope container, make the changes to the IncidentManagement ZenPack configuration and commit the snapshot so that the changes are persistent when the zenincidentpoll container is restarted.

From my Control Center I'm going to run the below command to start:
serviced service shell -i -s update_closed_sn zope

After that I can modify the appropriate file changing the values to match what I've discovered in the previous steps:

vi /opt/zenoss/ZenPacks/ZenPacks.zenoss.IncidentManagement-2.3.16-py2.7.egg/ZenPacks/zenoss/IncidentManagement/servicenow/action.py


After saving the file and exiting the Zope container using "exit" we now need to commit the new image using:
serviced snapshot commit update_closed_sn

After committing the snapshot you need to restart your zenincidentpoll container from the Zenoss Control Center UI and then your changes will be live and you should be able to close an Incident in ServiceNow and have Zenoss automatically close the associated Zenoss event as seen in the below event notes.


Hopefully that helps!


.

Monday, July 25, 2016

vCloud Director Logging

I was recently asked how to go about configuring the Log Insight Agent with VMware vCloud Director and thought that I would take the time to document it here for anyone else who is interested.

Logging in vCD is normally handled by log4j and configured by $VCLOUD_HOME/etc/log4j.properties.with the official KB located here. You should either use log4j OR the Log Insight Agent, but not both or you will have event duplication.

Log4j Configuration
First a quick overview of the log4j configuration.
1. Open $VCLOUD_HOME/etc/log4j.properties
2. Append "vcloud.system.syslog" to the rootLogger and make sure to not forget the comma before it
 3. At the bottom of the file go ahead and append the below 6 lines outlined in the KB making sure to change your target FQDN.
4. Unfortunately with vCD 5.x you also have to restart the vmware-vcd service for the changes to take effect. Hint: if you don't want to restart the services and take an outage you can continue reading and use the Log Insight Agent instead :)

Log Insight Agent
vCloud Director supports RHEL and CentOS so you only need to worry about the RPM install of the Log Insight Agent. First though, we need to do some prep work on the Log Insight Server.

1. Install the vCD Content Pack - On the Log Insight Server that you will be pointing your LI Agent at you will need to have the vCD Content Pack installed so the Agent Group is available. This is easily done via the Marketplace

2. Create your Agent Group - From the Administration window select Agents and then highlight the vCloud Director Cell Servers pre-defined Agent Group.
Next scroll to the bottom of the page and select Copy Template

3. Next you will need to define a filter that limits this collection to only vCD Cells. My test example here is very basic and limiting to hosts with a certain hostname prefix.
You can see in the bottom section of the agent group the actual files that will be collected by the agent.
By default the agent only collects info level logs but you can easily switch that to debug level logs if you desire. Feel free to check out my very basic sizing calculator on Github if you are curious of the impact of the additional logs. For now, just hit Save Agent Group to continue.

4. Now you are ready for the actual agent installation! You will need to copy the RPM to your vCD cells /tmp directory. The LI Agent will need to be installed and configured on every vCD Server.
Note: At some point after this step you will need to decide when to remove the log4j configuration and when to enable the Agent. I would personally recommend disabling log4j before installing the agent as short term you won't lose any events since the LI Agent will go through all the log files on the server and forward them on.

5. Install the agent via RPM

6.  If you downloaded the agent from the Log Insight server it is supposed to be forwarding to then you don't need to modify the liagent.ini file but if you downloaded it from my.vmware.com or another Log Insight Server you will need to update the target hostname.
If you want to be secure you can enable ssl and your /etc/liagent.ini file will look more like the below
Don't forget that you'll need certificates for SSL so follow the full official documentation available here 
 
At this point you should see that your agents are alive and sending data to your Log Insight Server


Friday, July 8, 2016

Early Boot Windows Debugging - Part 2 - Kernel Debugging over Serial

This post is a continuation of Part 1; I think I shall call it "Help, my ntbtlog.txt isn't being written to disk and I'm flying blind"

Ok, now I need more data because I'm not getting anywhere. Fortunately Windows still has the option to log kernel debugging over serial. A feature I wasn't aware existed util today. That brings up the big question: how do I make that work on a VM and a physical device without a serial port?

First you need to enable virtual printers in VMware Workstation under Edit > Preferences. Without this enabled Workstation can't attach to named pipes.
Next we need to add a virtual serial port to our VM and tell it to output to named pipe
Next accept or change the named pipe (only replace the part "com_1" if you change it) and set it so that "This end is the server" and "The other end is an application".  This means that your VM is the server and you are going to attach an application to the named pipe.
With that out of the way you need to install the Windows Debugging Tools which are included in the Windows SDK. Link for Windows 10 is here. After installing the debugging toolset we need to launch a new kernel debug session.
Go File > Kernel Debug in WinDbg
Next select the COM tab and fill it out with the below settings but replacing the name of the port with your named pipe.
Hit Ok and you should see your debugger start and say it's "Waiting to reconnect..."
Even if you boot the VM at this point you won't get any information first we need to boot to the Windows Repair wizard, go to Troubleshoot > Command Prompt and enable debugging using bcdedit.

Commands: 
bcdedit /bootdebug {bootmgr} on (Windows Boot Manager)
bcdedit /bootdebug on (boot loader)
bcdedit /debug on (OS Kernel debugger)

At this point you can now reboot. In theory this should be all that you need for debugging but I've noticed that the information is still lacking.

Instead have it boot explicitly to debug mode

Now your debug should have much more valuable information, this time pointing to "IOINIT: Built-in driver \Driver\sacdrv failed to initialize with status - 0xc0000037"


Congratulations, you can now see what is actually going on in your OS and where the root of the issue is at more more clarity.