Showing posts with label VMware. Show all posts

Thursday, June 8, 2017

Deploying vRealize Log Insight (vRLI) via API

I've finally gotten around to upgrading the vRLI Configuration Management and Audit Tool to handle the full deployment process as well as clustering! Let's take it for a spin to see what the new features allow us to do!

1. First we need to deploy the vRLI VMs from OVA that can be downloaded from my.vmware.com. Once they have been fully booted and you see them serving the following webpage we can start. You can close your browser at this point; nothing is required here other than we are checking to make sure that they are fully booted.


2. The tool uses a JSON configuration file that you can see a sample of by running the program with a "-d" flag or browsing the first part of the Python (my recommended approach). You can also generate a simplified version by calling the wizard using a "-b" flag. For now, I'm going to create my configuration file based on the sample in the documentation with a single Master Node under the "fqdn" key and 2 Secondary Nodes under the "nodes" key in my JSON file. This means that when the script is done I will have a new, 3 node vRLI Cluster. 


Let's kick off the program and tell it to use my configuration file by running:

python li-json-api.py -f  ctest.json -r

Note: the "-r", otherwise known as"remediation enabled" flag is required since building a new cluster requires changing settings. If you forget this step, don't worry, it will remind you. Also, remember that when building a new node/cluster you must supply the "admin" user's credentials.

Now, what's going on behind the scenes in the newly added code?
1. The script detects that the Master Node is in pre-bootstrap mode and is awaiting the initial configuration.
2. We complete the initial bootstrap process as partially described in the vRLI API documentation. The missing piece here is that the documentation never tells you that you need to explicitly use port 9543 for these calls. During deployment is the only time this is required.
3. We license the first node which allows us to add additional nodes.
4. We add each secondary node and authorize it with the Master and repeat until complete.

The process looks like this:


The rest of the operations that we do to configure the various settings in vRLI are all old functionality but none-the-less, important.

The code can be run as often as you would like without any ill effect. Our approach is to store our configuration files in source control and have the job run on a reoccurring basis to catch any unauthorized changes and automatically remediate configuration drift. Below is an example of me re-running the job against the cluster we just built. Because it is matching the desired state, no changes are executed against the cluster.


Let's say that our vRLI Cluster is growing (excellent!) and we want to add another node to it. No worries, just deploy a new VM and add the new IP/FQDN to your JSON configuration file as a new "node" and run the script again! 


As you can see, the original nodes are recognized as already in a cluster and the 4th node (.40) is discovered as a new node and added to the cluster.  


Wednesday, October 5, 2016

Getting Fancy with Log Insight Alerting (aka. Monitoring DHCP pools via logs)

Recently, I was asked about monitoring Microsoft DHCP IP Address Pools using Log Insight to alert when the pool was exhausted and DHCP requests were failing. There are a couple ways to do this, but I'd like to cover two as a demonstration of getting a bit fancy with your alert queries and it paying off big time!

First off, Microsoft DHCP Servers write their events to a log file - at the end of the day.... so we can parse that file for an Event ID of 14 to see when we ran out. This is easy to do as shown below using Event ID 11 (DHCP Renew) as an example. The regex is simple but unfortunately we get the information way too late!


Enter the Log Insight Agent's ability to read Windows Event Logs! As your DHCP Server starts running low on available addresses in a certain pool it starts to throw warnings in the System Event Log with an Event ID of 1376 that state what percent is currently used and how many addresses are still available.


It would be really cool if we could have Log Insight fire off an alert if these messages showed that we were above 90% used, right? But it's text... how do we do math on text in log messages? The good news is that not only can you accomplish this; it's easy to do!

First off, we need to create an Extracted Field that allows us to treat the value of percentage used as an integer. Simply highlight the number and select "Extract Field"

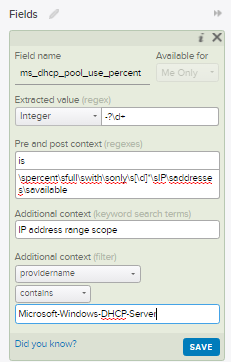
Now you will have a dialog box on the right hand side that allows you to define what exactly makes this extracted field. Let's look into these options with a bit of detail...
Extracted Value: For this use case you will be leaving this field alone as any changes will remove the type of "Integer". This can be problematic if you have numbers with a comma (1,000) but the engineering team is aware of it. For now, leave it as is.

Pre Context: This is a regex defining what comes before our desired value. In this example it is the word "is" from "is 85 percent full".

Post Context: The same as pre-context just for the regex after the value. It's important to make both the pre and post context detailed enough that they only apply to this exact context/event type. It's better to go a bit overboard with the regex than make it too simple. Just make sure to keep some room available in the text for the next item, keyword search terms....

Additional Context (keyword search terms): In this section you'll want to add in keywords that are found in the data outside of your regex. In this case my keywords match strings found before my pre-context regex. These are important as they help improve your query performance and lighten the load on your Log Insight Server.

Additional Context (filter): Why search through 2 billion events when you only need to search 100? That's exactly why you should also use filters to help narrow down where this Extracted Field will apply. Your users will thank your for keeping the performance on your Log Insight Server at peak efficiency!

Now that we have our Extracted Field defined we can modify our initial query to have an additional filter that says "ms_dhcp_pool_use_percent" (Name of our new Extracted Field) is greater that X%! This is demonstrated in the below screenshot where everything below 86% is dropped, and consequentially, would never be alerted on.


Lastly we need to define an alert off of our new query. Select the little red bell and select "Create Alert from Query"

Here we define the new alert properties for when our alert query returns a result.

And with that you're done!

Special thanks to my co-worker Simon Long for bringing up the need for this cool use case!


Monday, July 25, 2016

vCloud Director Logging

I was recently asked how to go about configuring the Log Insight Agent with VMware vCloud Director and thought that I would take the time to document it here for anyone else who is interested.

Logging in vCD is normally handled by log4j and configured by $VCLOUD_HOME/etc/log4j.properties.with the official KB located here. You should either use log4j OR the Log Insight Agent, but not both or you will have event duplication.

Log4j Configuration
First a quick overview of the log4j configuration.
1. Open $VCLOUD_HOME/etc/log4j.properties
2. Append "vcloud.system.syslog" to the rootLogger and make sure to not forget the comma before it
 3. At the bottom of the file go ahead and append the below 6 lines outlined in the KB making sure to change your target FQDN.
4. Unfortunately with vCD 5.x you also have to restart the vmware-vcd service for the changes to take effect. Hint: if you don't want to restart the services and take an outage you can continue reading and use the Log Insight Agent instead :)

Log Insight Agent
vCloud Director supports RHEL and CentOS so you only need to worry about the RPM install of the Log Insight Agent. First though, we need to do some prep work on the Log Insight Server.

1. Install the vCD Content Pack - On the Log Insight Server that you will be pointing your LI Agent at you will need to have the vCD Content Pack installed so the Agent Group is available. This is easily done via the Marketplace

2. Create your Agent Group - From the Administration window select Agents and then highlight the vCloud Director Cell Servers pre-defined Agent Group.
Next scroll to the bottom of the page and select Copy Template

3. Next you will need to define a filter that limits this collection to only vCD Cells. My test example here is very basic and limiting to hosts with a certain hostname prefix.
You can see in the bottom section of the agent group the actual files that will be collected by the agent.
By default the agent only collects info level logs but you can easily switch that to debug level logs if you desire. Feel free to check out my very basic sizing calculator on Github if you are curious of the impact of the additional logs. For now, just hit Save Agent Group to continue.

4. Now you are ready for the actual agent installation! You will need to copy the RPM to your vCD cells /tmp directory. The LI Agent will need to be installed and configured on every vCD Server.
Note: At some point after this step you will need to decide when to remove the log4j configuration and when to enable the Agent. I would personally recommend disabling log4j before installing the agent as short term you won't lose any events since the LI Agent will go through all the log files on the server and forward them on.

5. Install the agent via RPM

6.  If you downloaded the agent from the Log Insight server it is supposed to be forwarding to then you don't need to modify the liagent.ini file but if you downloaded it from my.vmware.com or another Log Insight Server you will need to update the target hostname.
If you want to be secure you can enable ssl and your /etc/liagent.ini file will look more like the below
Don't forget that you'll need certificates for SSL so follow the full official documentation available here 
 
At this point you should see that your agents are alive and sending data to your Log Insight Server


Friday, July 8, 2016

Early Boot Windows Debugging - Part 2 - Kernel Debugging over Serial

This post is a continuation of Part 1; I think I shall call it "Help, my ntbtlog.txt isn't being written to disk and I'm flying blind"

Ok, now I need more data because I'm not getting anywhere. Fortunately Windows still has the option to log kernel debugging over serial. A feature I wasn't aware existed util today. That brings up the big question: how do I make that work on a VM and a physical device without a serial port?

First you need to enable virtual printers in VMware Workstation under Edit > Preferences. Without this enabled Workstation can't attach to named pipes.
Next we need to add a virtual serial port to our VM and tell it to output to named pipe
Next accept or change the named pipe (only replace the part "com_1" if you change it) and set it so that "This end is the server" and "The other end is an application".  This means that your VM is the server and you are going to attach an application to the named pipe.
With that out of the way you need to install the Windows Debugging Tools which are included in the Windows SDK. Link for Windows 10 is here. After installing the debugging toolset we need to launch a new kernel debug session.
Go File > Kernel Debug in WinDbg
Next select the COM tab and fill it out with the below settings but replacing the name of the port with your named pipe.
Hit Ok and you should see your debugger start and say it's "Waiting to reconnect..."
Even if you boot the VM at this point you won't get any information first we need to boot to the Windows Repair wizard, go to Troubleshoot > Command Prompt and enable debugging using bcdedit.

Commands: 
bcdedit /bootdebug {bootmgr} on (Windows Boot Manager)
bcdedit /bootdebug on (boot loader)
bcdedit /debug on (OS Kernel debugger)

At this point you can now reboot. In theory this should be all that you need for debugging but I've noticed that the information is still lacking.

Instead have it boot explicitly to debug mode

Now your debug should have much more valuable information, this time pointing to "IOINIT: Built-in driver \Driver\sacdrv failed to initialize with status - 0xc0000037"


Congratulations, you can now see what is actually going on in your OS and where the root of the issue is at more more clarity.


Early Boot Windows Debugging - Part 1 - Basics

I have a Windows Server 2012 VM that will not boot past the Windows splash screen but throws a BSOD with the error "SYSTEM_THREAD_EXCEPTION_NOT_HANDLED (NETIO.SYS). It's been a long while since working on troubleshooting Windows (I primarily use CentOS) but here's what I've found. I don't have the solution yet but I'm recording some tidbits that I found so I will have them later.

First a bit of preamble:

1. Advanced Boot Options - When you select "Enable Boot Logging" this is supposed to write a log file named ntbtlog.txt. However, in this particular case that never happens. This is presumably because it is before the appropriate driver is loaded to write log files. However with 2012 this is conjecture since the latest Microsoft documentation that I can find applies to Server 2000. Regardless of reason, it isn't captured in this instance.
2. This VM was originally running on ESXi but I have exported and OVF to my local VMware Workstation for my troubleshooting.
3. In the below operations I will be referencing "d:\" which is actually the c:\ of the server. It is referenced from the rescue command prompt as d:\ on my system.

Step 1: Boot to the command prompt from the troubleshooting menu in the Automatic Repair wizard
Step 2: Run a chkdsk to verify the filesystem is in working order. My scan came back with required repairs which it corrected. Subsequent scans come back clean.

Command: chkdsk d: /f
Step 2: Run sfc to verify that Windows is ok. This returns that everything is ok

Command: sfc /offbootdir=d:\ /offwindir=d:\Windows /scannow
Step 3 - Just for grins I also ran DISM (Deployment Image Servicing and Management) to check the integrity. It will throw a warning if you don't give it a scratch directory so I just created a temporary one on my drive. This also returns no found corruption.

Command: dism /image=d:\ /cleanup-image /scan-health /scratchdir=d:\temp
So far, so good... except it still won't boot up. I have an existing "twin" of this machine that should match it in most regards so just to be super certain I also run a manual hashing check on netio.sys and sacdrv.sys (more on that file later). The syntax for that is:

certutil.exe -hashfile drivers\netio.sys md5 (or sha1)

The number 1 cause of netio.sys BSOD are driver conflicts according to googling so I start down that road next. An export of all the drivers between the 2 systems shows that they are absolutely identical. Because that doesn't help me I start yanking out drivers to see if it will make a difference.

To get a list of non-Microsoft drivers I again use DISM and find that there are fortunately only 8 to worry about.

Command: dism /image:d:\ /scratchdir:d:\temp /get-drivers

I'm going to start removing drivers to see if that makes any difference. Again, using DISM I start by removing the vmxnet3 driver since it makes the most sense considering a netio.sys error.

Command: dism /image:d:\ /scratchdir:d:\tetmp /remove-driver:oem4.inf

After a reboot, no change. In 1 of my tests I also then proceed to remove the 7 remaining drivers, that also did nothing. Time to get more information.... Queue next post.... 


Friday, July 1, 2016

Log Insight Configuration API Audit and Standalone Remediation Tool - Updated!

For those of you who are interested I have updated the API based audit and remediation tool with a couple new features. After all, what is the use of automation if it isn't user friendly?

1. Better error handling of remediation errors: In the past you would just get a message to the effect of "Something went wrong" but now the tool will pass the HTTP status code and Error Details from the Log Insight Server's response to your remediation request. In the below example you can see this in action.

2. Now includes a wizard to help build a simplified JSON configuration file! Now, without having to create a single bit of JSON you can quickly get value from the tool. The wizard is simplified because let's be honest, if you want the wizard you don't want to answer 250 questions. Because of this some things are assumed/disabled. If you want them then you can simply add it to the code or use the template in the included docs (use the -d switch).

I hope that this helps you get started in seeing the value of using Configuration APIs to manage your Log Insight Servers!

Wednesday, May 18, 2016

Log Insight Configuration APIs

For those of you who have followed my blog you will know that I deal with Log Insight quite a bit in our production environments. Because of this I was excited that in the latest release of Log Insight 3.3 there are several new Configuration API's released under Tech Preview status. That said, the documentation around these APIs is very difficult to nail down. The exciting part is that I've just uploaded a new and unofficial standalone audit and remediation tool to my github repo! As always this code is my personal code and not supported or officially recognized by VMware.

Here's how it works: 
The tool reads the desired state of your Log Insight Server from a JSON file that you define. It can use that file to then connect to the Log Insight Server and audit it to see if it matches your desired state. If you wish you can throw in the -r switch and the script will make the Log Insight Server match your desired state.

Let's see it in action:
First up, let's pull up the embedded documentation by running the script with the -d switch to see what the JSON file needs to look like. I've taken pains to try and include complex examples so that you won't be left in the dark on anything.
  
After creating a new JSON file with our desired state it's time to run the tool in audit only mode by just specifying the -f flag and the name of our JSON file. The results that come back are that we have several areas that need remediation (email, event forwarders) and 1 (content packs) that cannot be remediated yet (hopefully in a later version).
 
That's all good but we want the tool to fix those issues so we append the -r flag
If you run the tool again the output comes back as all objects matching desired state but the nice thing is that you don't need to run it again. Once the remediation HTTP POST is sent to the server the tool will automatically go back and query the server for the configuration to verify that your changes have been implemented and the server is now set correctly. It will then show you success in the message immediately following the remediation step. 

The portions of Log Insight that the tool has the ability to configure are:
License Key
NTP Configuration
SMTP Configuration
Event Forwarder Configuration
Active Directory Configuration
RBAC Configuration
Content Packs (audit only right now)

Stay tuned as I plan on updating the tool over time as more APIs are released and as my python knowledge increases. In the meantime happy auditing and automatic remediation!


Thursday, May 29, 2014

Setting vShield Edge Device Syslog via API

If you need to update your vSE devices to send traffic to a syslog server then you might be slightly disappointed to see that there are no instructions in the vCNS API guide to do this, especially if you have a bunch of edges. I experienced this same feeling today and am happy to say that now you don’t have to. Below are a quick couple scripts that will allow you to update single edges or a whole bunch at once using curl!

1. First off we need to get a list of our edge devices from the vCNS Manager. We will be using the edgeID acquired here to configure the syslog settings in a minute.

Get Edges

2. This list is a bit too much for our use so I’m going to parse it down to just the edgeID of all the devices.

vSE List

3. But I’m going to add them all to a text file (edges_test.txt) that I can parse later (code below):

curl -k -H "Authorization: Basic XXXXXXXXXXXXX" -X GET https://vsm.sub.domain.com/api/3.0/edges | xmllint --format - | grep "<id>edge-[0-9]*" | sed -n 's/<id>//p' | sed -n 's/<\/id>//p' > edges_test.txt

Now you have to make a decision, modify individual edges or all of them?

a. Let’s just edit one (MAKE SURE to set the edgeID in the below statement):

curl -k -H "Authorization: Basic XXXXXXXXXXXXX" -H "Content-Type: application/xml" -d '<?xml version="1.0" encoding="UTF-8"?><syslog><enabled>true</enabled><protocol>udp</protocol><serverAddresses><ipAddress>XX.XX.XX.XX</ipAddress></serverAddresses></syslog>' -X PUT https://vsm.sub.domain.com/api/3.0/edges/edge-282/syslog/config

b. Let’s edit them all! For this one I have a simple bash script that loops through the text file with all the edge devices and runs the curl statement against them.

Here’s the script:

while read edge; do
echo "Beginning Update on $edge"
curl -k -H "Authorization: Basic XXXXXXXXXXXXX" -H "Content-Type: application/xml" -d '<?xml version="1.0" encoding="UTF-8"?><syslog><enabled>true</enabled><protocol>udp</protocol><serverAddresses><ipAddress>XX.XX.XX.XX</ipAddress></serverAddresses></syslog>' -X PUT
https://vsm.sub.domain.com/api/3.0/edges/$edge/syslog/config
echo "Ending Update on $edge"
sleep 5s
done < edges_test.txt

Really simple but very effective!

start script

Now all that is left is to verify the results:

curl -k -H "Authorization: Basic XXXXXXXXXXXXX" -X GET https://vsm.sub.domain.com/api/3.0/edges/edge-282/syslog/config | xmllint --format -

Verify results

Have fun not having to use the UI :)

Thursday, March 20, 2014

Cloud Content Pack (vCD) for Log Insight

For those of you out there who use VMware vCloud Director and Log Insight you may be interested in a content pack that we have built for use by the OneCloud team to help make our cloud run smoother and to give us a ton of (wait for it) Insight into our environment. It's been a work in progress for about 9 months off and on but has served us very well. I hope that it serves you just as well.

Here are some screenshots:


I hope that this content pack is able to help you better manage your VMware vCloud Director environment. You can download the Content Pack here just be aware that this is not released by VMware and is not supported by them. Like everything else on my blog it just came from a random blogger on the internet :)


Friday, October 18, 2013

Clustering vCenter Orchestrator 5.5 using PostgreSQL.

It’s funny, I’ve edited this post 4 times because I ran into little catch-22 situations as I continued to work using my test vCO instance. Hopefully this post will save somebody else some time when configuring vCO 5.5 in a cluster. Let’s get started!

Deploy a new VM that will host the PostgreSQL Database. I’m using CentOS just in case you are curious.

You can find the latest version of PostgreSQL with:

yum list postgres*

1

Now install PostgreSQL-server:

yum install postgresql-server

Once it is done installing then we need to configure Postgres:

chkconfig --level 2345 postgresql on

service postgresql initdb

vim /var/lib/pgsql/data/postgresql.conf

Un-comment and modify the listen_addresses and port:

2

Next modify the what servers are allowed to talk to the Postgres database and how. The database and user have not been created yet but we are going to call them vco and vcouser. The method is an md5 hash of the password for authentication.

vim /var/lib/pgsql/data/pg_hba.conf

3

Now start Postgres and create the vCO user and database:

service postgresql start

su postgres

psql

CREATE USER vcouser with PASSWORD '$uperG00dP@ss!';

CREATE DATABASE vco;

GRANT ALL PRIVILEGES on DATABASE vco to vcouser;

\q

Now I’m going to deploy 3 vCO appliances from OVA. Near the end of the process to deploy the OVA you will be prompted to create a password. The second password's username is vmware and it is for the web interface that you will use in a minute to configure vCO.

4

Go to to http://<primary vCO node IP> and click on Orchestrator Configuration. From here login using vmware for the username and the password that you specified when you deployed the OVA.

5

Next go to the Database section and fill in the information for the PostgreSQL database server we just built. It should fail with an error that the database needs tables created. Click to create.

6

Once you click to create the tables then it's time to generate self-signed certificates. Navigate to the Server Certificate section and chose the self-signed option. Give it the FQDN of your VIP. (Example: I have cos-test-vco1, cos-test-vco2 and cos-test-vco3 but the VIP is cos-test-vco)

7

Now we need to grab our vCenter Server's SSL Certificate. Click on Licenses and SSL Certificates

8

Give it https://<IP of vC Server> and verify the import.

9

Add any plugins that you want (they can be found at https://solutionexchange.vmware.com).

Next navigate to the Licenses section and give it the IP of your vCenter. Once this succeeds you should have all green statuses.

10

It's now time to configure vCO to work in a cluster. Go to Server Availability and change it to have 2 active nodes:

11

Next navigate to vCenter Server and add a new vC. BEWARE: the default setting is "Session per user" and this will appear to succeed on this screen but will be broken later on down the road if you don't change it. The only reason this should be left at the default is if you are using SSO and the same user has rights on both vCO and vCenter Server.

12

Now because of the change going from the internal to the external Postgres database we need to reinstall all the plugins even though they show up as green on the configuration screen. Don't believe me? If you continue as-is you will run into the below screenshot where your workflow elements are gone.

13

To do that click "Reset Current Version" and reboot the VM.

14

Lastly we need to modify the network binding to the correct IP address:

15

Once you have reached this point it's time to export the vCO Configuration. This is critical because all of your vCO servers in the cluster must be identical with the exception of the network binding. Copy this file via SCP to the other Orchestrator VMs.

16

Next repeat the below steps for each additional vCO server.

Import the vCO Master Node's configuration file making sure to UNCHECK the override box.

17

Configure networking to the correct IP address for each node.

18

At this point you should get an error that says that vCenter is not configured correctly. Follow the prompts and re-enter your credentials to connect to the vC Server.

19

Once this is completed start your Primary Node and wait for it to start, then start all the other nodes.

20

Repeat for all nodes until they show as online.

21

Congratulations, you have now configured a vCO Cluster with a standby node.