Friday, February 12, 2016

Log Insight - Migration to debug level logs

One of the projects that I am working on is enabling the forwarding of debug logs on all of our VMware vCloud Director Cells to our global Log Insight instance. To do this however we need a fairly accurate appraisal of what the increased overhead is going to look like. As part of this process I'm starting to create a python program that will allow me to quickly find what the current Events per Second (EPS) and log size in KBps are.


As you can see the script can be run locally or be pointed at a remote host and looks for the latest fully committed debug log. If you don't want to use that one, no worries, you can easily specify a different log file to use. If the target is a remote server the script will copy the appropiate log file to the machine running the script and then do the analytics locally to remove any possibility of unnecessary overhead from the cell server.

The script is still in active development as a side project but I hope to add the ability to query vCenter Servers as well in the near future. If you're curious the code is hosted on my Github repo and as always is not supported or affiliated with VMware in any way....

Thursday, December 17, 2015

Zenoss Monitoring WinRM Error (Server not found in Kerberos database: HTTP@XX.XX.XX.XX

We recently rolled out Zenoss 5 in an environment and when we attempted to connect to Windows Servers over WinRM using a domain user received the below error:

Error on : Server not found in Kerberos database: HTTP@10.xx.xx.xx

  
After doing a tcpdump on the Zenoss server using "tcpdump -s 65535 -w filename.dmp"and loading the results into wireshark I found this in the traffic between Zenoss and the Domain Controller:
Turns out the Zenoss server was looking for an SPN of the FQDN of my Windows host and not the hostname. We went ahead and added a new SPN for the FQDN using "setspn -S HTTP/ < FQDN > < hostname >" and that resolved the issues!

One other side note: In one of the Zenoss documents that I saw it mentioned the need to install the krb5-workstation package on your remote collectors. This is easily accomplished by "yum -y install krb5-workstation" but due to the sequence of of my troubleshooting I cannot prove/disprove that it made a difference. If anyone finds this and can sort out that detail I'd be happy to hear the results.


Friday, July 24, 2015

Presenting at VMworld 2015

I will be presenting at VMworld 2015 in session MGT4579 on "Data In-Sight!! Experiences Running VMware's Private Cloud with Log Insight". If you are at VMworld feel free to attend and say hi as I'd love to get to meet you in person!

Thursday, July 10, 2014

Log Insight Content Pack for vCD

Hey all,
I just released the official GA version of the vCD 5.5 Log Insight Content Pack which is now available on the VMware Solutions Exchange at https://solutionexchange.vmware.com/store/products/vcd-log-insight-content-pack#.U77ZHPldV8E. Take a look and let me know of any changes that you think would be helpful to you.


Thursday, May 29, 2014

Setting vShield Edge Device Syslog via API

If you need to update your vSE devices to send traffic to a syslog server then you might be slightly disappointed to see that there are no instructions in the vCNS API guide to do this, especially if you have a bunch of edges. I experienced this same feeling today and am happy to say that now you don’t have to. Below are a quick couple scripts that will allow you to update single edges or a whole bunch at once using curl!

1. First off we need to get a list of our edge devices from the vCNS Manager. We will be using the edgeID acquired here to configure the syslog settings in a minute.

Get Edges

2. This list is a bit too much for our use so I’m going to parse it down to just the edgeID of all the devices.
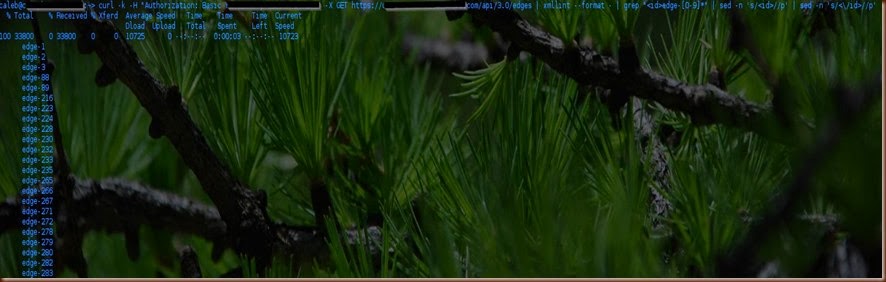
vSE List

3. But I’m going to add them all to a text file (edges_test.txt) that I can parse later (code below):

curl -k -H "Authorization: Basic XXXXXXXXXXXXX" -X GET https://vsm.sub.domain.com/api/3.0/edges | xmllint --format - | grep "<id>edge-[0-9]*" | sed -n 's/<id>//p' | sed -n 's/<\/id>//p' > edges_test.txt

Now you have to make a decision, modify individual edges or all of them?

a. Let’s just edit one (MAKE SURE to set the edgeID in the below statement):

curl -k -H "Authorization: Basic XXXXXXXXXXXXX" -H "Content-Type: application/xml" -d '<?xml version="1.0" encoding="UTF-8"?><syslog><enabled>true</enabled><protocol>udp</protocol><serverAddresses><ipAddress>XX.XX.XX.XX</ipAddress></serverAddresses></syslog>' -X PUT https://vsm.sub.domain.com/api/3.0/edges/edge-282/syslog/config

b. Let’s edit them all! For this one I have a simple bash script that loops through the text file with all the edge devices and runs the curl statement against them.

Here’s the script:

while read edge; do
echo "Beginning Update on $edge"
curl -k -H "Authorization: Basic XXXXXXXXXXXXX" -H "Content-Type: application/xml" -d '<?xml version="1.0" encoding="UTF-8"?><syslog><enabled>true</enabled><protocol>udp</protocol><serverAddresses><ipAddress>XX.XX.XX.XX</ipAddress></serverAddresses></syslog>' -X PUT
https://vsm.sub.domain.com/api/3.0/edges/$edge/syslog/config
echo "Ending Update on $edge"
sleep 5s
done < edges_test.txt

Really simple but very effective!

start script

Now all that is left is to verify the results:

curl -k -H "Authorization: Basic XXXXXXXXXXXXX" -X GET https://vsm.sub.domain.com/api/3.0/edges/edge-282/syslog/config | xmllint --format -

Verify results

Have fun not having to use the UI :)

Thursday, March 20, 2014

Cloud Content Pack (vCD) for Log Insight

For those of you out there who use VMware vCloud Director and Log Insight you may be interested in a content pack that we have built for use by the OneCloud team to help make our cloud run smoother and to give us a ton of (wait for it) Insight into our environment. It's been a work in progress for about 9 months off and on but has served us very well. I hope that it serves you just as well.

Here are some screenshots:


I hope that this content pack is able to help you better manage your VMware vCloud Director environment. You can download the Content Pack here just be aware that this is not released by VMware and is not supported by them. Like everything else on my blog it just came from a random blogger on the internet :)


Friday, March 14, 2014

Monitoring VMware vCenter Servers using HTTP Health checks

If you are curious about monitoring your VMware vCenter Servers which I am sure that most of you are then you might find this interesting. Did you know that you can monitor the:

  1. VMware vSphere Profile-driven Storage Service
  2. vCenter Inventory Service
  3. ESX Agent Manager
  4. vService Manager
  5. vCenter Storage Monitoring Service
  6. vCenter Logging Services
  7. Autodeploy Service

All with a simple, unauthenticated HTTP GET request? Here’s how:

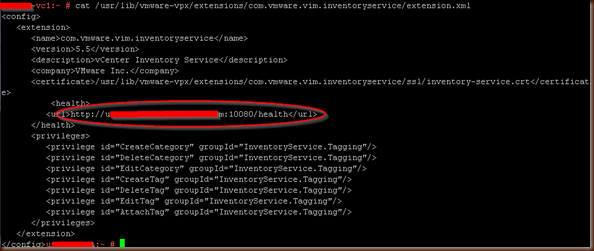
Inside of /usr/lib/vmware-vpx/extensions/ you will find several sub folders, one for each extension and inside of those an extension.xml file. That file contains the URL for the healthcheck for each service.

image

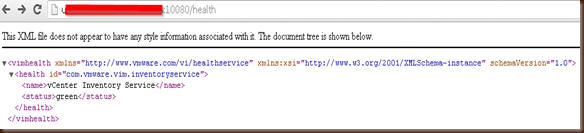
If you do a GET request against the URL listed it will return a bit of XML that includes the status of the service that you are inquiring about.

image

For quick reference here are the ones currently available in 5.x

https://<FQDN>/sps/health.xml - Storage Profile Service
https://<FQDN>/sms/health.xml - vCenter Storage Monitoring Service
http://<FQDN>/eam/eamService-web/health.xml - ESX Agent Manager
https://<FQDN>vsm/health.xml - vService Manager
https://<FQDN>:8443/ls/health - vCenter Logging Services
https://<FQDN>:6502/vmw/rbd/health-info - Autodeploy Service

The inventory Service works out of box on a Windows vCenter but on the vCSA you will need to open port 10080 on the iptables firewall first, preferably only to your monitoring host.

http://<FQDN>:10080/health - vCenter Inventory Service

and here is the needed firewall update:

iptables -I INPUT -p tcp –s <SOURCE IP> --dport 10080 -j ACCEPT
service iptables save