Tuesday, November 19, 2013

Intelligent Password Changes with Puppet

I need to change the root password on all my hosts but I have a small problem: some hosts have older md5 hashed passwords and the newer ones use the more secure SHA-512 hash. If I did not care about the different hashes and wanted to have SHA-512 across the board I would do a very simple manifest entry to make this happen: Problem is I want to replace the old md5 hashes with new md5 hashes and the old SHA-512 with new SHA-512; not something that Puppet supports very easily. To do this we are going to build a new module with a Custom Fact written in Ruby. First off I need to explain some things if you are new to Puppet.

  • A module is stored under /etc/puppet/modules and is called via an include declaration in the site.pp Master Manifest
  • A module has it's own Manifest called init.pp under /etc/puppet/modules/<module_name>/manifests
  • Inside the init.pp is a class that MUST be named the same as your folder structure. Example: if the folder at /etc/puppet/modules/<module_name> is named "rootpass" then your class declaration must be "class rootpass {...."
  • A module is very powerful and the functionality is written in Ruby

Now that we have those out of the way lets start. If you are doing this your self here is the folder structure to make life easier:

password-structure

Let's visit each component a piece at a time

1. Custom Fact - sha512rootpass.rb. Puppet if Statements can be a bit tricky (see http://docs.puppetlabs.com/learning/variables.html) so in this case I needed a Custom Fact that checked to see if the root password was a SHA-512 hash which is indicated by it starting with "$6$" (md5 is $1$). If the root password is indeed a SHA-512 hash then the variable sha512rootpass will return with a "true" value. This functionality is delivered by Ruby Facter. For more information take a look at http://docs.puppetlabs.com/guides/custom_facts.html. My custom fact is silly simple, it just greps the shadow file for "root:$6$*" and if it's there then returns "true" which means that root has a SHA-512 hashed password.

password-sha512

2. New Class - init.pp. The logic for the operation that we actually want to run is located in the init.pp file. Here is where we define our class (reminder, it needs to be the same as you top level folder name). This one basically says "If root is using a SHA-512 password hash (defined by $sha512rootpass = true) replace it with this new one. If not then assume it's md5 and replace it with this new md5 hash.

password-init

Now we need to tell Puppet what servers to apply this to and this is done by modifying the site.pp Manifest on the Puppet Master. For now I'm going to apply it to all my nodes and so I just add it to my default. If you wanted you can add a new section that says "node <hostname> {include rootpass}" and it would be applied just to that host.

password-include

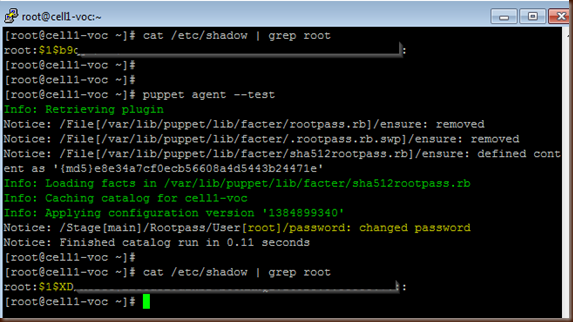
Now lets test it on an agent box that has an md5 hashed password and a box that has a SHA-512 password. Our older box with md5 is the first up to bat.....

password-md5

As you can see the password was a md5 ($1$) and was changed appropriately. Next let's look at a box with SHA-512.

password-shachange

As you can see the old password was a SHA-512 hash and has been replaced with the new SHA-512 hash. Success!

Getting Started with Puppet Open Source

I'm starting to work with Puppet and noticed that when I am using the open source version there is not really a good "Getting Started" guide and documentation is rather lacking. Not wanting anyone else to suffer through that here is my attempt at it. Hope it helps others.

Building the Puppet Master

First we are going to check what OS we are running, in my case it's CentOS 6.4 x64 so we're going to grab the repo from yum.puppetlabs.com. After that I look to see what's available and then finally install with a yum install puppet-server.noarch.

 puppet-repo

Once Puppet is installed we need to do some things. First we take a look at the stock puppet.conf file. Now, let's make it useful by adding the server name (remember: this is the Puppet Master so it's $HOSTNAME) and enabling pluginsync.

puppet-start-config

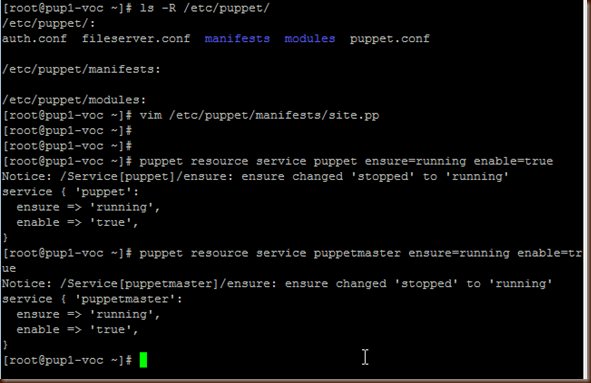
As you can see the file structure of Puppet is pretty empty with the open source version... Let's add site.pp which is the master Manifest for all your Puppet tasks.

puppet-site.pp

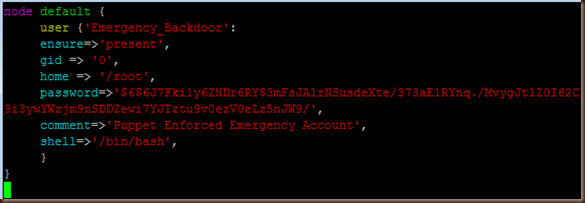
I'm going to add a very simple puppet command that applies to all hosts (nodes) and creates a new user with a SHA-512 password hash. This Manifest file is the source of truth for all your Puppet tasks, more about that later for now remember site.pp is critical.

puppet-site-pp-creation

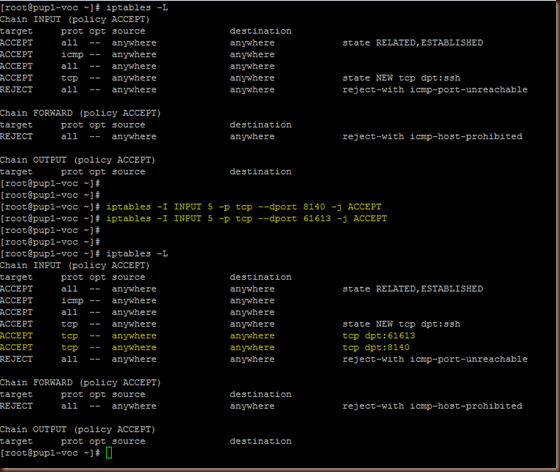
Lastly before starting the services we need to open 2 ports on the firewall.

iptables-puppet

Now that the Manifest is complete and we have open ports let's start the Puppet and Puppet Master services.

puppet-running

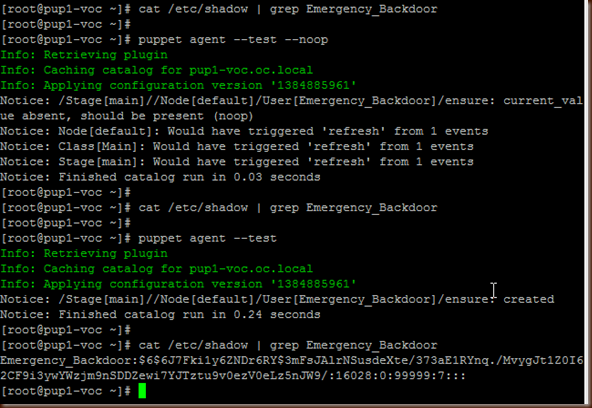
We did all that work, let's see if Puppet works. (Note, if you get an error here there is a good chance that iptables is blocking your Puppet traffic). To do that we are going to call the Puppet agent and tell it to run, but not apply any changes (-noop). As we can see it detected that our new user account is missing but did not change anything.

puppet-noop-test

That's all great, now let's apply it. There are a couple ways to do this:

1. Wait 30 minutes, the agent will automatically run and apply the change.

2. Run puppet agent --test

puppet-add-user

As we can see, the change was successfully made on the Puppet Master, now lets go start installing an agent on another host.

Installing Puppet Agents

As you can see we are doing basically the same thing as on the Puppet Master but only installing the Puppet Agent.

puppet-agent-install

After the install completes we need to configure the agent to talk to the Puppet Master. This configuration is done in the same /etc/puppet/puppet.conf as the Puppet Master but we change what we add...

puppet-agent-config

Next you need to start the Puppet Agent Service: puppet resource service puppet ensure=running enable=true

At this point assuming no firewall issues your agent is now talking to the Puppet Master (test using the "puppet agent --test --noop" command we used earlier); however there is still one thing that needs to be done. We need to approve the agent's certificate on the Puppet Master; once that is complete then the agent will start applying changes that are specified in the Puppet Master's site.pp. You do that from the Puppet Master using the puppet cert commands:

puppet-sign-cert

Congratulations! You just setup a Puppet Open Source instance and are now well on your way to using Puppet to help you manage your infrastructure.

Tuesday, October 22, 2013

IPv6 Regex

I needed to do a massive rip and replace on some IPv6 IP’s and so a regex seemed the best way to go.

What I was using: Link-local

fe80::([0-9a-f])*:([0-9a-f])*:([0-9a-f])*:([0-9a-f])*

All IPv6 IP’s.

([0-9a-f])*::([0-9a-f])*:([0-9a-f])*:([0-9a-f])*:([0-9a-f])*

Friday, October 18, 2013

Clustering vCenter Orchestrator 5.5 using PostgreSQL.

It’s funny, I’ve edited this post 4 times because I ran into little catch-22 situations as I continued to work using my test vCO instance. Hopefully this post will save somebody else some time when configuring vCO 5.5 in a cluster. Let’s get started!

Deploy a new VM that will host the PostgreSQL Database. I’m using CentOS just in case you are curious.

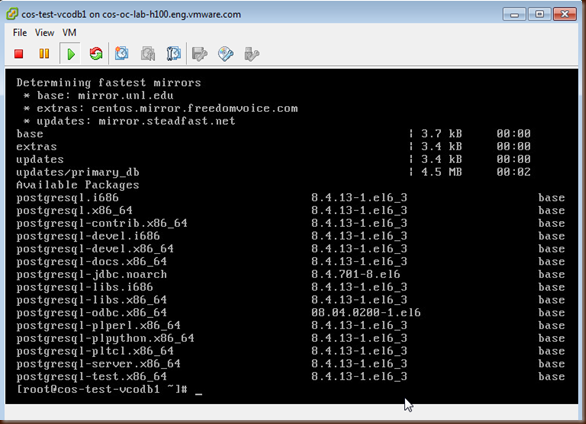
You can find the latest version of PostgreSQL with:

yum list postgres*

1

Now install PostgreSQL-server:

yum install postgresql-server

Once it is done installing then we need to configure Postgres:

chkconfig --level 2345 postgresql on

service postgresql initdb

vim /var/lib/pgsql/data/postgresql.conf

Un-comment and modify the listen_addresses and port:

2

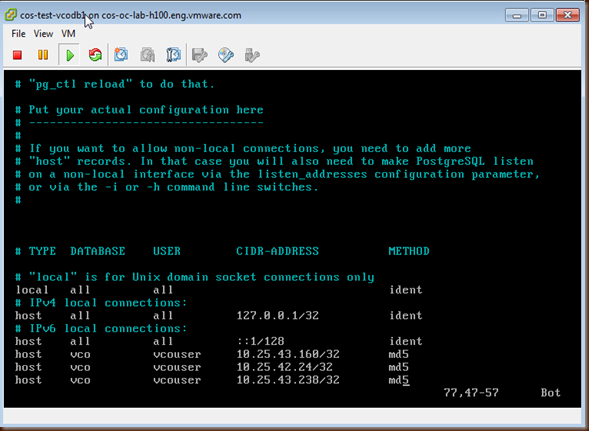
Next modify the what servers are allowed to talk to the Postgres database and how. The database and user have not been created yet but we are going to call them vco and vcouser. The method is an md5 hash of the password for authentication.

vim /var/lib/pgsql/data/pg_hba.conf

3

Now start Postgres and create the vCO user and database:

service postgresql start

su postgres

psql

CREATE USER vcouser with PASSWORD '$uperG00dP@ss!';

CREATE DATABASE vco;

GRANT ALL PRIVILEGES on DATABASE vco to vcouser;

\q

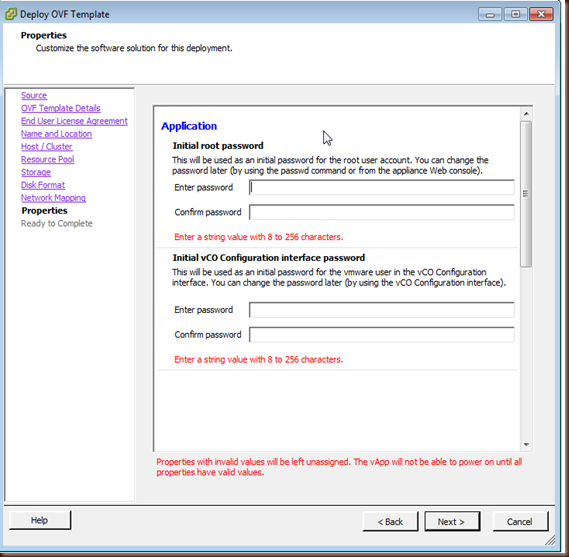
Now I’m going to deploy 3 vCO appliances from OVA. Near the end of the process to deploy the OVA you will be prompted to create a password. The second password's username is vmware and it is for the web interface that you will use in a minute to configure vCO.

4

Go to to http://<primary vCO node IP> and click on Orchestrator Configuration. From here login using vmware for the username and the password that you specified when you deployed the OVA.

5

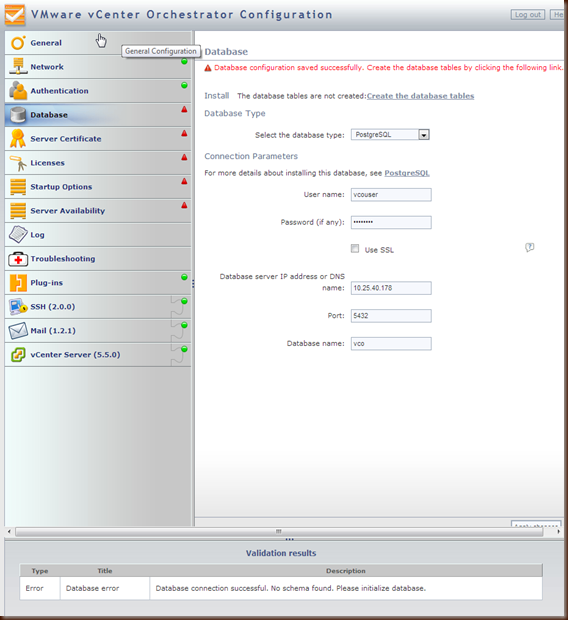
Next go to the Database section and fill in the information for the PostgreSQL database server we just built. It should fail with an error that the database needs tables created. Click to create.

6

Once you click to create the tables then it's time to generate self-signed certificates. Navigate to the Server Certificate section and chose the self-signed option. Give it the FQDN of your VIP. (Example: I have cos-test-vco1, cos-test-vco2 and cos-test-vco3 but the VIP is cos-test-vco)

7

Now we need to grab our vCenter Server's SSL Certificate. Click on Licenses and SSL Certificates

8

Give it https://<IP of vC Server> and verify the import.

9

Add any plugins that you want (they can be found at https://solutionexchange.vmware.com).

Next navigate to the Licenses section and give it the IP of your vCenter. Once this succeeds you should have all green statuses.

10

It's now time to configure vCO to work in a cluster. Go to Server Availability and change it to have 2 active nodes:

11

Next navigate to vCenter Server and add a new vC. BEWARE: the default setting is "Session per user" and this will appear to succeed on this screen but will be broken later on down the road if you don't change it. The only reason this should be left at the default is if you are using SSO and the same user has rights on both vCO and vCenter Server.

12

Now because of the change going from the internal to the external Postgres database we need to reinstall all the plugins even though they show up as green on the configuration screen. Don't believe me? If you continue as-is you will run into the below screenshot where your workflow elements are gone.

13

To do that click "Reset Current Version" and reboot the VM.

14

Lastly we need to modify the network binding to the correct IP address:

15

Once you have reached this point it's time to export the vCO Configuration. This is critical because all of your vCO servers in the cluster must be identical with the exception of the network binding. Copy this file via SCP to the other Orchestrator VMs.

16

Next repeat the below steps for each additional vCO server.

Import the vCO Master Node's configuration file making sure to UNCHECK the override box.

17

Configure networking to the correct IP address for each node.

18

At this point you should get an error that says that vCenter is not configured correctly. Follow the prompts and re-enter your credentials to connect to the vC Server.

19

Once this is completed start your Primary Node and wait for it to start, then start all the other nodes.

20

Repeat for all nodes until they show as online.

21

Congratulations, you have now configured a vCO Cluster with a standby node.

Tuesday, August 27, 2013

VMworld 2013 Hands On Labs!

Here’s a little preview of one of our two OneCloud datacenters that is running VMworld 2013 Hands On Labs. We’re using Hyperic, vC Ops and VMware Log Insight to make sure that you guys have the best labs possible! Enjoy!

Check out these awesome custom vC Ops Dashboards!

vC Ops

This one displays vCD information such as the current VM Consoles that each cell server is serving to clients. Most of these metrics are gathered via a custom Hyperic vCD Plugin that we built (to be posted later).

vC Ops 2

Simple but effective Lab and VM deployment stats and trending.

SQL Deployments

Shout out to my co-worker Jacob Ross who was my teammate in designing and building the monitoring for VMworld 2013 HOL. Hope you all enjoy the show!

Wednesday, August 21, 2013

Monitoring vCD 5.1 vAPP deployment times with SQL

Whipped up a quick set of SQL scripts that will allow me to monitor vAPP deployment times in vCloud Director 5.1. Maybe somebody out there will also find them useful.

--Finds the deployment and vAPP creation times over a set period of time which is currently 6 hours.
select distinct
     Jobs.operation
    ,Jobs.object
    ,Jobs.Task_Length_Minutes
    ,COUNT(Jobs.job_id) as VM_Count
    ,Jobs.Minutes_Since_Task
    ,Jobs.OrgVDC
from (
      select top 2500
         jobs.job_id
        ,jobs.starttime
        ,jobs.stoptime
        ,jobs.object
        ,jobs.operation
        ,DATEDIFF(MINUTE,(jobs.starttime),(jobs.stoptime)) AS Task_Length_Minutes
        ,DATEDIFF(MINUTE,(jobs.starttime),getdate()) as Minutes_Since_Task
        ,org_prov_vdc.name AS OrgVDC
     from jobs
         Join vapp_vm on vapp_vm.vapp_id = jobs.object_id
            JOIN vm_container on vm_container.sg_id = jobs.object_id
            JOIN org_prov_vdc on org_prov_vdc.id = vm_container.org_vdc_id
        WHERE jobs.operation IN (
                  'VAPP_DEPLOY'
                  ,'VDC_INSTANTIATE_VAPP')
            AND DATEPART(YEAR, stoptime) <> 9999
            AND DATEDIFF(MINUTE,(jobs.starttime),getdate()) <=360
               Group by jobs.object, jobs.starttime, jobs.stoptime, jobs.operation, vapp_vm.name, jobs.job_id, org_prov_vdc.name
      ) Jobs
Group BY  Jobs.operation
    ,Jobs.object
    ,Jobs.Task_Length_Minutes
    ,Jobs.Minutes_Since_Task
    ,Jobs.OrgVDC
    Order by Minutes_Since_Task      


--Finds the Average Deployment Time by vAPP Name over a set period of time which is currently 6 hours.
SELECT Jobs.object
        ,AVG(Jobs.TaskLengthSeconds) as AverageDeployTime
        ,Jobs.ElapsedTimeMinutes
FROM (SELECT top 500 jobs.object
,jobs.starttime
        ,jobs.stoptime
        ,DATEDIFF(MINUTE,(jobs.starttime),(jobs.stoptime)) AS TaskLengthSeconds
        ,DATEDIFF(MINUTE,(jobs.starttime),getdate()) as ElapsedTimeMinutes
     FROM jobs
        WHERE (jobs.operation = 'VAPP_DEPLOY' or jobs.operation = 'VDC_INSTANTIATE_VAPP') and DATEPART(YEAR, stoptime) = 2013
            Group by jobs.object, jobs.starttime, jobs.stoptime
                Order by jobs.starttime DESC) Jobs
WHERE CAST(ElapsedTimeMinutes AS int) <=360
    Group by Jobs.object, Jobs.ElapsedTimeMinutes
        Order by Jobs.ElapsedTimeMinutes

       
--Finds the Longest Deployment Time by vAPP Name over a set period of time which is currently 6 hours.
SELECT Jobs.object
        ,MAX(Jobs.TaskLengthMinutes) as MaxDeployTime
FROM (select top 2500 jobs.object
        ,jobs.starttime
        ,jobs.stoptime
        ,DATEDIFF(MINUTE,(jobs.starttime),(jobs.stoptime)) AS TaskLengthMinutes
        ,DATEDIFF(MINUTE,(jobs.starttime),getdate()) as ElapsedTimeMinutes
     FROM jobs
        WHERE jobs.operation = 'VAPP_DEPLOY' or jobs.operation = 'VDC_INSTANTIATE_VAPP' and stoptime not like '%9999%'
            Group by jobs.object, jobs.starttime, jobs.stoptime
                Order by jobs.starttime DESC) Jobs
WHERE CAST(ElapsedTimeMinutes AS int) <=360
    Group by Jobs.object           
        Order by MaxDeployTime

Monday, August 5, 2013

Updating, Replacing or Downgrading Hyperic System Plugins

Sometimes you have an updated Hyperic plugin that you need to replace with a different version on an agent and it will not push for various reasons. To get around this just copy the new plugin file directly to /opt/hyperic/hyperic-hqee-agent/bundles/agent-5.7.0/pdk/plugins on the agent machine and restart the agent service (service hyperic-hqee-agent restart). At this point you are good to go.

Monday, June 3, 2013

RHEL / CentOS 6 Multiple Interfaces on same subnet - network unreachable

I ran into an interesting issue with CentOS 6.4 when I added a second nic on the same subnet as the first. What happens is that I can ping the first interface from outside its subnet but not the second. Also, if from the CentOS host using the second interface I try to ping local IPs it works but IP's that need to use the default gateway fail and show network unreachable even though the default gateway is correctly configured.

Thanks to a very helpful post at http://www.centos.org/modules/newbb/viewtopic.php?topic_id=40726&forum=58 I learned that this is due to a change between version 5 and 6 regarding Reverse Path Filtering. To fix this issue in RHEL 6 and CentOS 6 you need to modify the /etc/sysctl.conf file like the below:

rp_filter - BOOLEAN
1 - do source validation by reversed path, as specified in RFC1812
Recommended option for single homed hosts and stub network
routers. Could cause troubles for complicated (not loop free)
networks running a slow unreliable protocol (sort of RIP),
or using static routes.

0 - No source validation.

conf/all/rp_filter must also be set to TRUE to do source validation
on the interface

Default value is 0. Note that some distributions enable it
in startup scripts.

whereas in RHEL6 (cf. /usr/share/doc/kernel-doc-2.6.32/Documentation/networking/ip-sysctl.txt) there are three possible values for this setting:

rp_filter - INTEGER
0 - No source validation.
1 - Strict mode as defined in RFC3704 Strict Reverse Path
Each incoming packet is tested against the FIB and if the interface
is not the best reverse path the packet check will fail.
By default failed packets are discarded.
2 - Loose mode as defined in RFC3704 Loose Reverse Path
Each incoming packet's source address is also tested against the FIB
and if the source address is not reachable via any interface
the packet check will fail.

Full credit to the centos.org forum user who had the original fix, I just thought I would share since it was a bit hard to find.

Tuesday, February 5, 2013

Isolating Java Process to vCD Job

Let’s assume that one of your vCD cells is using a bit of CPU and you are curious what actual task inside of vCD is requiring all of those resources. Here’s how you can find out.

Get the PID from “top –H –u vcloud”; this is the specific task in vCD as opposed to the vCD general process you will find later. In my case the PID = 16225

Convert this PID to Hex = 3F61 or 0x3F61

Find the vCD Java Process; “ps –auxf |grep vcloud” should return at least 2 results. You want the process that has /opt/vmware/vcloud-director/jre/bin/java.

Get a java thread dump with “kill –3 < vCD Java Process PID>”.

Go search the cell.log (/opt/vmware/vcloud-director/logs) for the Hex value of the process that you are trying to identify. In our case the process we want to investigate is 0x3F61. A quick search for that value brings up the java trace of what vCD is attempting to do.

Friday, January 25, 2013

Java Class Path Error–invalid flag

I’m brand new to Java and by no means a professional coder but due to the nature of my job I have to be able to write a little bit of code in different languages. Yesterday I found out that I needed to be able to write a bit of Java for a project I’m working on so you may see Java related stuff on my blog the next couple days. Here’s the first thing I noticed:
I tried to include a folder of .jar files when I complied my code using the following syntax
javac –cp lib/* test.java
This promptly fails with the error “invalid flag: lib/commons-codec-1.4.jar”
The fix is that apparently you have to put the path inside double quotes like:
javac –cp “lib/*” test.java

On a side note just download a Java IDE like Spring Tool Suite and make your life much easier :)

Tuesday, January 22, 2013

Pushing New Plugin to Hyperic Agents

If you ever update a plugin on your Hyperic Server you may need to push it out to your Hyperic Agents. To do this find you Hyperic Agent under the Servers group. It should look like <Server Name> HQ Agent 5.0.0. Select this and go to the Views tab. From here select Agent Commands and Push Plugin. After pushing your plugin you will need to restart the agent using the same Agent Commands section.

Thursday, January 17, 2013

Apt-Get Proxy Settings

I needed to tell apt-get to use a specific proxy and here is what I found after some googling…

1. Go to /etc/apt/apt.conf.d/

2. Create a new file called “80proxy”

3. Put your proxy information in said file in the following format:

Acquire::http::proxy “http://proxy.domain.com:port/”;

Acquire::https::proxy “http://proxy.domain.com:port/”;

Acquire::ftp::proxy “http://proxy.domain.com:port/”;

Multiple Monitors on Linux Mint XFCE

If you want to run multiple monitors with Linux Mint I found a great way to do it thanks to http://forums.linuxmint.com/viewtopic.php?f=57&t=122367.

sudo apt-get install arandr

Then go to Menu > Settings > ARandR and align the monitors correctly. It’s as easy as it should be.

Tuesday, January 15, 2013

Writing PowerCLI for Performance

I was building a piece of PowerCLU code to check on my vCD Deployed vAPPs for certain errors and because it’s me I was curious what performance difference there was between using array based operations verses piped operations in powershell. Here’s what I found out.

Here is the array based operation – time to completion 2 minutes 30 seconds.

$myVAPP = @(Get-CIVApp | Select-Object Org, Name, Status)
        foreach ($myVAPP.Name in $myVAPP)
            {
                IF ($myVAPP.Status -eq "FailedCreation")
                    {
                        Write-Host 'vAPP' $myVAPP.Name' - Status is' $myVAPP.Status
                    }
                ELSE
                    {
                            IF ($myVAPP.Status -eq "Unresolved")
                            {
                                Write-Host 'vAPP' $myVAPP.Name' - Status is' $myVAPP.Status
                            }
                            else
                            {
                                IF ($myVAPP.Status -eq "Unknown")
                                {
                                    Write-Host 'vAPP' $myVAPP.Name' - Status is' $myVAPP.Status
                                }
                                else
                                {
                                }
                            }                           
                    }
            }
           

Here is the pipe based operation which is recommended for reasons that I now can testify for first hand.

Get-CIVApp -Status "Unresolved", "FailedCreation", "Unknown", "Unrecognized" | Select-Object Org, Name, Status

This operation returned the same results as the array based operation in 14 seconds, that’s 9% of the original time of using an array…

Friday, January 11, 2013

vFabric Hyperic Server Heartbeat

I wrote a quick safety feature for my Hyperic server that monitors the Hyperic Server process every minute and if the Server stops or dies the script will attempt to restart it. Nothing fancy but it’s a nice little feature… plus you can change a couple lines and make one to monitor your Hyperic Agents as well…

#!/usr/bin/perl
# ---------- Hyperic 5.0.0 Server Heartbeat Check ------------
# This script is used to verify that the Hyperic 5.0.0 Server is running and
#    restarts it upon failure. To schedule it to run automatically every
#    minute on linux run the following:
#         crontab -e */1 * * * * <Path to this script>

# NOT SUPPORTED OR PROVIDED BY VMWARE AND HAS NO GUARENTEES

$cmd = "/opt/hyperic/server-5.0.0-EE/bin/hq-server.sh status";
$out = `$cmd`;
# print "Output $cmd\n";
# print "Output Check 1 - $out\n";
if (index($out, "HQ Server is not running") != -1)
        {
                # print "\nHQ Server is dead\n";
# Restart the HQ Service
                $cmd = "/opt/hyperic/server-5.0.0-EE/bin/hq-server.sh start" ;
                $out = `$cmd`;
                # print "Restarting the Service\n $out \n ";
        }
        else
        {
                # print "\nServer is running\n";
        }

Getting Started with vFabric Hyperic Monitoring and Alerting

During the past couple days I have been working with Hyperic to setup basic alerting functionality for things like disk space thresholds, Windows Services and memory usage by process. Here is a quick getting started to setup basic disk monitoring as well as an intro to the Hyperic Escalation Schemes which allow tiered alerting.

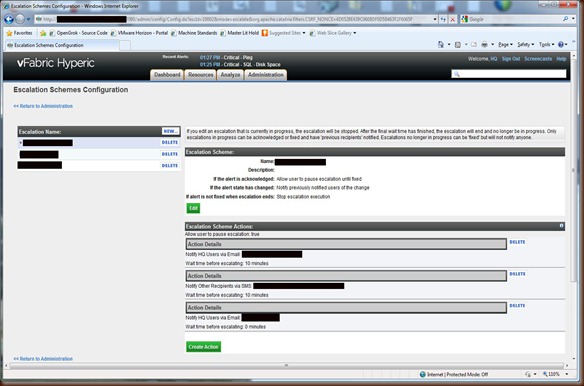
First off let’s create an Escalation Scheme. To do this go to Administration > Escalation Schemes Configuration.

Hyperic_alert_groups_6

Next Let’s go ahead and build the process of who gets alerted and when.

Hyperic_alert_groups_7

Now that we have setup the notification process let’s actually setup some alerts…For this example I will be setting up test disk space alerts on a subset of my servers. To get here you need to understand a few things:

1. Under the Resources Tab is where you are going to find all your things that can be monitored. Here comes the confusing part:

a. Platforms is the Server that your Hyperic Agent is running on.

b. Servers are things like .net, Apache Tomcat and MSSQL Server.

c. Services are things that you monitor like HTTP, Disks, CPU, RAM and Windows Services.

d. Compatible Groups/Clusters are groups of the same thing (ie, Disks only)/

e. Mixed Groups are groups that contain a mix of things like Disks and RAM.

Once you grasp this it will make your experience with Hyperic much easier.

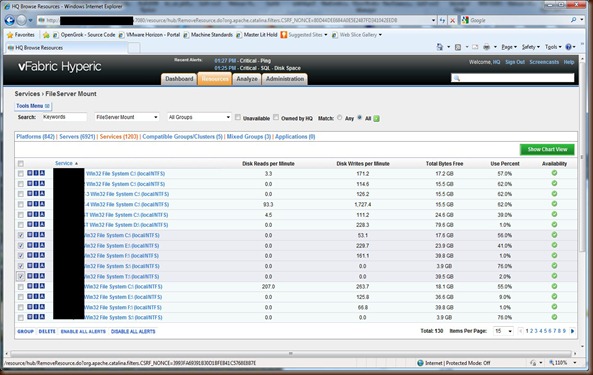
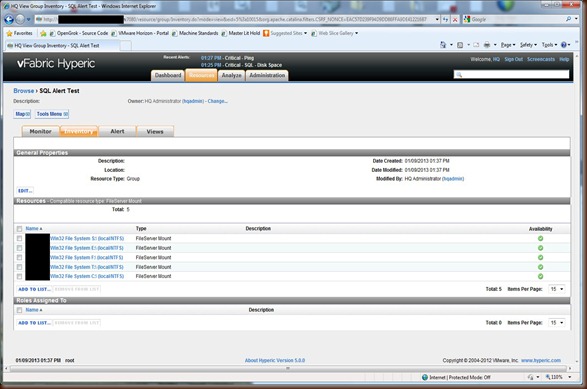
Ok, so I have navigated to the Services Tab and filtered by “FileServer Mount” aka Disk information. Now I want to select my subset of disks and click on the Group button. Hyperic_alert_groups_1

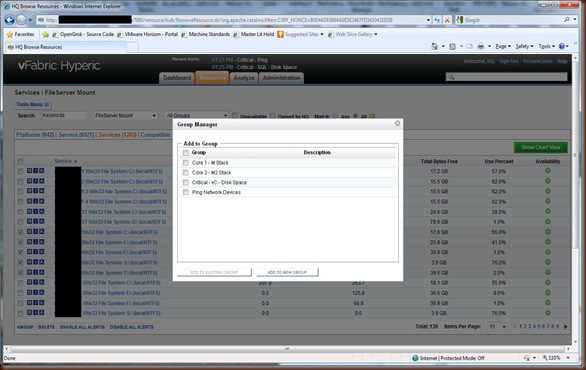
Next I click on "Add to a New Group”  to create a new group. Because this group contains all like items it will create a new Compatible Group.

Hyperic_alert_groups_2

Now you should see your new group.

Hyperic_alert_groups_3

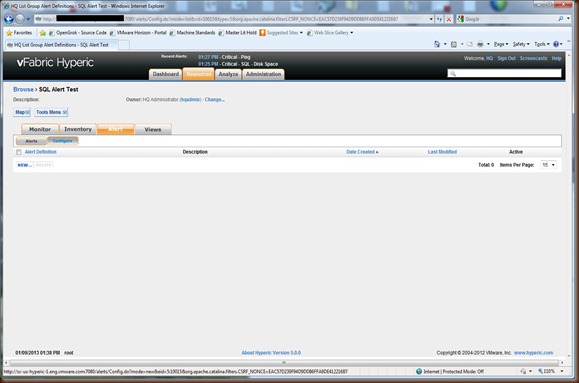
From there click on the Alerts tab and click on Configure

Hyperic_alert_groups_4

Now I want to create a new alert against this group of servers. My normal if statement is “IF more THAN 0 of the Resources” because I want alerts if any of them go down.

Hyperic_alert_groups_5

Here’s an important note: if you select Total Bytes Avail or several other metrics your alert will NOT work by default, here’s why:

Go to Administration > Monitoring Defaults and find FileServer Mount and click Edit Metric Template.

Hyperic_alert_groups_9

This should bring up a screen like the below. Notice that the Default On is set to No for the Total Bytes Avail… if you build your alert on that setting and don’t check to make sure that valid data is coming in you might be lulled into a false sense of security… Word to the wise, make sure your monitors are green after you create them.

Hyperic_alert_groups_8

Congrats, you are now ready to use vFabric Hyperic to start basic monitoring in your environment.